Matplotlib可视化中文字体显示问题解决方案
本文最后更新于:2021年7月10日 下午
# matplotlib可视化中文字体显示问题解决方案
踩坑描述
使用matplotlib这个python数据可视化包总是会遇到中文字体变成方框,指定字体也不奏效。
解决方案
注:方案一是万能的,方案一yyds!
方案一 使用自定义字体
import matplotlib.pyplot as plt
from matplotlib import font_manager
# 自定义字体文件存放的路径
font_dirs = ['path/to/font/']
font_files = font_manager.findSystemFonts(fontpaths=font_dirs)

for font_file in font_files:
#     print(font_file)
    font_manager.fontManager.addfont(font_file)
# 设置字体,这里是微软雅黑
plt.rcParams['font.family'] = 'SimHei'
比如说要解决Windows端的字体显示问题,直接把系统字体路径搬来就行。
import matplotlib.pyplot as plt
from matplotlib import font_manager
# 使用Windows系统自带字体库
font_dirs = ['C:/Windows/Fonts/']
font_files = font_manager.findSystemFonts(fontpaths=font_dirs)

for font_file in font_files:
    # print(font_file)
    font_manager.fontManager.addfont(font_file)
# 设置中文字体
plt.rcParams['font.family'] = 'SimHei'
方案二 添加字体到matplotlib资源包
找到matplotlib包所在路径
import matplotlib
print(matplotlib.matplotlib_fname())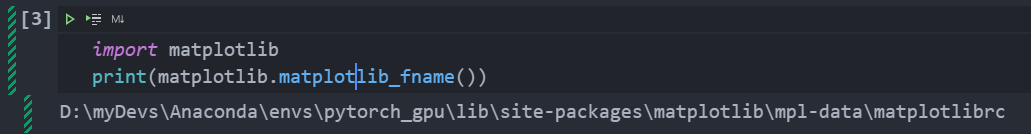
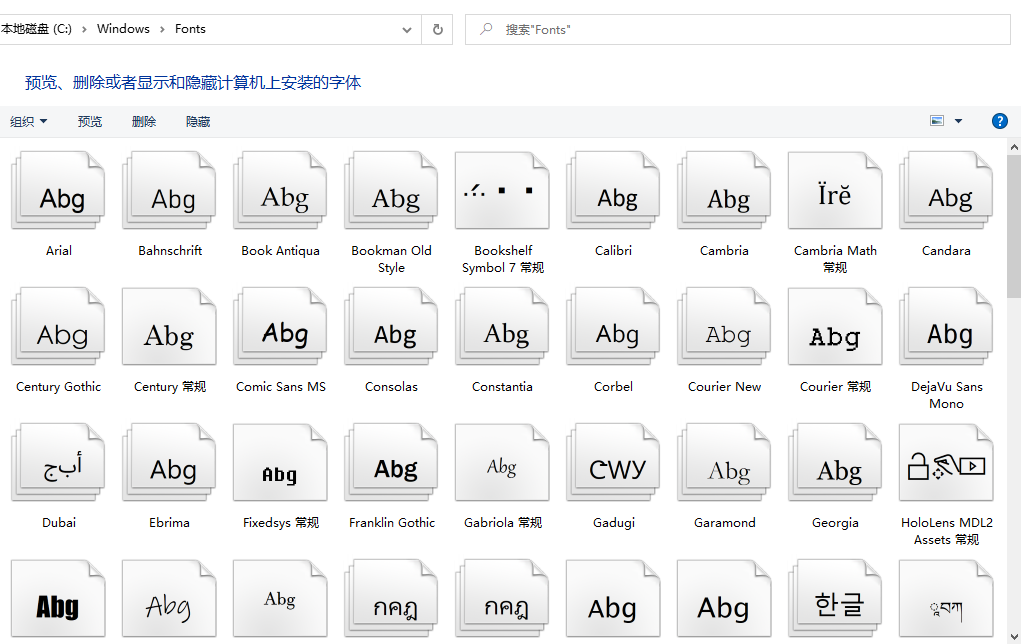
打开windows自带字体文件夹C:\Windows\Fonts
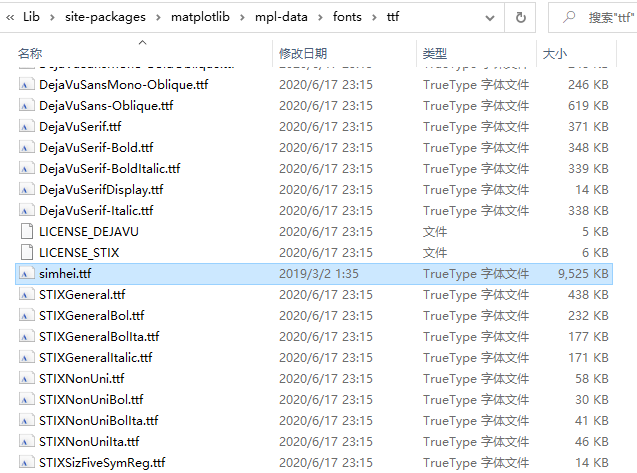
将里面的字体文件复制到
去掉注释加入simhei
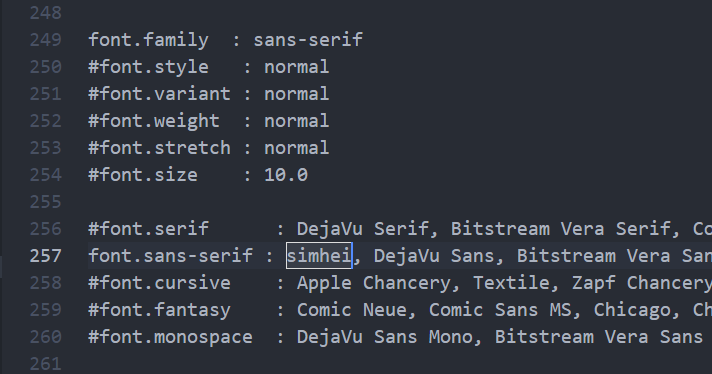
font.family那行注释不用动
plt.rcParams['font.sans-serif']=['simhei']方案一比较万能,方案二是我的一次尝试,也记录一下。
– 2021.6.1更新 –
方案三 FontProperties
方案一有时候好像也会失效[啪啪打脸],那就把所有解决过我问题的方案都记录下,方案三应该是万能的了吧[嗯!]
# 字体配置
from matplotlib.font_manager import FontProperties
myfont = FontProperties(fname=r"/simhei.ttf", size=14) #fname指定字体文件  选简体显示中文
# 之后所有使用中文字体的地方只字符串都以u""的形式出现,并指定fontproperties属性为我们的指定的myfont就行
mpl.rcParams['axes.unicode_minus'] = False # 消除更换为unicode字体之后0、负数之类的显示异常

# ==中文字体用法==
# ax1.set_ylabel(u'测试',fontproperties=myfont)
# plt.title(u"中文字体测试", fontproperties=myfont)
# plt.xlabel(u"年龄", fontproperties=myfont)
# # plt.ylabel(u"密度", fontproperties=myfont)
# plt.legend((u'测试1', u'测试AAA',),loc='best', prop=myfont)本博客所有文章除特别声明外,均采用 CC BY-SA 4.0 协议 ,转载请注明出处!